SEMI 2026 Sustainability White Paper: Decarbonizing the Semiconductor Value Chain

The Semiconductor Industry has more Data than Ever on Where its Emissions Come From and Which Actions Could Make the Biggest Difference.
Semi is the global industry association for the semiconductor and electronics design and manufacturing supply chain. Founded in 1970, it brings together more than 4,000 member companies. Its work spans industry standards, the SEMICON expositions, market intelligence, advocacy, workforce development, and sustainability.
The Semiconductor Climate Consortium (SCC) is SEMI’s group on sustainability. It brings companies across the chip value chain together to share information, discuss industry priorities and drive climate action. Its Ambition Statement commits to helping members reach net-zero greenhouse gas emissions by 2050 at the latest.
Why This Report Matters Now
The semiconductor industry is on track to pass $1 trillion in revenue in 2026, years ahead of most forecasts. AI is driving much of that growth fueled by advanced chips, fabrication of which consumes more energy and materials. Consequently, the industry’s emissions continue to rise much faster than anticipated as the world relies on chips to run electric vehicles, modern grids, and renewable energy systems.
The SCC tracks this challenge through its Baselining, Ambition-setting, and Roadmapping (BAR) whitepaper. CarbonBetter authored the 2026 edition, led by Pankaj Tanwar, Managing Director of Climate Services, with climate analyst Sayali Chaudhari.
The whitepaper estimates baseline industry emissions from 2018-2023 across the full value chain using company disclosures to CDP as its main data source. Beyond baseline emissions, the whitepaper provides a granular view on emissions hotspots by part of value chain, raw materials or the relevant scope category highlighting where emissions are concentrated and models six pathways the industry could take to decarbonize through 2050.

“The semiconductor industry is going through a period of significant growth; balancing this accelerated demand with the need to decarbonize requires a deliberate and collaborative effort to support development of clean energy, investment in R&D and innovation and utilization of carbon markets to offset residual emissions.”
-Pankaj Tanwar, Managing Director of Climate Services
What’s New in the 2026 Edition
The first edition, published in 2023, set the industry’s emissions baseline. This edition significantly enhances that baseline and adds a modeled plan for reaching the 1.5°C Pathway.
Highlights include:
- Five action areas for the SCC: The whitepaper highlights 5 key areas for the industry to focus on to achieve the potential decarbonization pathways: Clean energy, fab Scope 1, upstream materials, carbon dioxide removal, and data quality.
- More robust data coverage: The analysis covers about 250 companies, up from ~180, with emissions data through 2023.
- Six years of trends: The report tracks Scope 1, 2, and 3 emissions each year from 2018 to 2023, alongside fab utilization and wafer shipments.
- Change in approach with the utilization of Market-based estimation as opposed to location base estimation: The 2026 analysis reflects market-based Scope 2 emissions estimation for the 2050 pathways, showing the impact of renewable energy certificates (RECs) and power purchasing agreements (PPAs) which the semiconductor industry is driving.
- Emission hotspots: New analysis breaks emissions down by material, geography, gas, and end use to show where action has the greatest impact.
- Six scenarios through 2050: The white paper models six potential pathways, illustrating how different levels and timing of decarbonization action could shape industry emissions through 2050.
- A modeled role for carbon dioxide removal (CDR): The 1.5°C Pathway includes a two-stage carbon removal ramp starting in 2031, with net-zero Scope 1 and 2 emissions by 2040.
- A price tag for carbon removals: The report estimates what the carbon removal ramp costs per year and per square inch of wafer.
- Five risks that need to be actively managed: A new section identifies the risks that could slow decarbonization and derail progress.
Where the Industry's Emissions Come From
The semiconductor value chain emitted 481 million tons (Mt) of CO₂e in 2023. Three-quarters of that total sits outside the fab, in Scope 3.
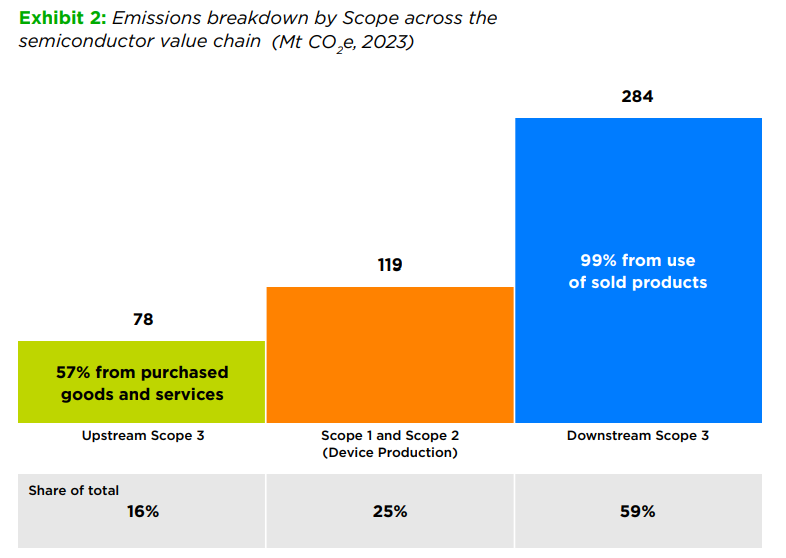
[Exhibit 2 from the report: Emissions breakdown by Scope across the
semiconductor value chain]
Electricity is the Largest Lever
About 84% of value chain emissions come from generating the electricity used across the chip lifecycle, from producing materials and equipment, to designing, fabricating, assembling and testing chips, to powering them in use. Low-carbon electricity in key manufacturing markets is the single biggest opportunity, and it depends on grids, policy, and many companies acting together.
The Remaining 16% is Harder to Cut and Requires Investment in Innovation and R&D
The rest comes from upstream materials and the process gases used inside fabs. Scope 1 emissions were 30.2 Mt in 2023, about 6% of the total. Perfluorocarbons (PFCs) made up 31% of that; some of these gases trap thousands of times more heat than CO₂, so small releases have an outsized effect.
What Changed Between 2018 and 2023
Scope 1 emissions peaked at 39 Mt in 2021 and fell to 30 Mt in 2023. Lower fab utilization during the industry downturn drove most of that decline, with wider use of gas abatement systems adding to it. Scope 2 emissions held close to 90 Mt in 2022 and 2023 on a location-based basis. On a market-based basis, which reflects renewable energy purchases, 2023 Scope 2 emissions were 62 Mt.
Emission Hotspots
The new edition highlights the areas where emissions concentrate, informing the industry on where coordinated investment has the potential to drive the greatest impact.
Upstream materials
Three material categories lead upstream Scope 3 emissions from purchased goods and services.
| Material | Share of Upstream Scope 3 | What It Means |
|---|---|---|
| Chemicals | 22% | Acids and solvents drive emissions; progress needs supplier engagement and greener alternatives |
| Wafers | 15% | Wafer production is energy-intensive and tied to the supplier's local grid |
| Gases | 13% | Nitrogen dominates by volume; fluorinated gases carry the highest warming potential |
Manufacturing geography
Mainland China accounts for about 30% of the industry's location-based electricity emissions. Taiwan, South Korea, and Japan together account for a further 50%. The pace of grid decarbonization in these four markets will shape the industry's ability to reach its 2050 goals.
Data centers
Data centers account for about half of downstream Scope 3 emissions, at 148 Mt in 2023. Automotive and consumer uses studied in the analysis add 0.4 Mt and 0.2 Mt. High-performance chips for AI workloads draw far more power than chips in phones or cars, which makes hyperscalers and data center operators key partners for cutting downstream emissions.
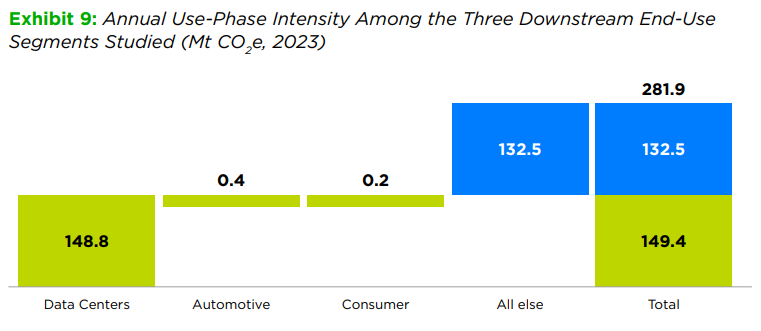
[Exhibit 9 from the report]
How Earlier Action Changes the Emissions Curve
The report models six scenarios for manufacturing emissions through 2050, examining how the timing and strength of decarbonization measures can change the industry's long-term emissions trajectory. Across the scenarios, stronger action taken earlier creates a fundamentally different emissions pathway.
What Stronger Decarbonization Action Could Require
- Accelerating Scope 1 emissions reductions
- Expanding access to low-carbon electricity
- Accelerating the transition to low-carbon electricity across Asia Pacific
- Using carbon dioxide removal to address residual emissions
The report concludes that meaningful progress is achievable, and that choices made in the next five years will shape the industry's role in the global energy transition. Accelerating progress will require coordinated action from chip designers, foundries, assembly and test providers, equipment and materials suppliers, energy providers, and policymakers.
Read the complete white paper on Semi's Website